隅歩つ

書いて理解を深める

JavaScriptのCanvasでテキストを使う

JavaScriptCanvasを勉強中です。

今回はテキスト(文字)を入れる方法を確認します。

テキストを使う方法

テキストを入れる場合は、「ctx.font」を使います。

ctx.font = '60px serif'

▼ テキストの色の設定

色の設定は図形などと同じです。

ctx.fillStyle = 'black'

▼ テキストの中心の設定

ctx.textAlign = 'center'

他には、"left"や"right"があります。

developer.mozilla.org

▼ テキストの高さの設定

ctx.textBaseline = 'middle'

他には、"top"、"hanging"、"alphabetic"などがあります。

developer.mozilla.org

▼ テキストの配置

テキストの配置は「ctx.fillText」を使います。

ctx.fillText(
    'テキスト',
    canvas.width / 2(x軸の位置),
    canvas.height / 2(y軸の位置)
)

比較的に簡単に設定できました。

実例

実際に入れてみました↓

Canvasでテキストを使う

以下がコードです。

ctx.fillStyle = 'black'
ctx.font = '60px serif'
ctx.textAlign = 'center'
ctx.textBaseline = 'middle'
ctx.fillText(
    'JavaScriptのCanvasでテキストを使う',
    canvas.width / 2,
    canvas.height / 2
)

あとは、Google Fontsなども試してみようと思います。

yuuuha.hatenablog.com

matplotlib の patches を使って図形を作る

PythonJavaScriptCanvas のようなことができないかな、と思って調べてみたら patches というのがありました。

よく使うであろう、円(Circle)と四角(Rectangle)の作り方を確認しました。

patchesの使い方

まず図形を作るためには「patches」を使います。

patches を使う手順

  1. patches を import する
  2. patches.Circle()を定義する
  3. add_patch(patch)に入れる

patches をインポートする

from matplotlib import patches

patches.Circle()で定義する

patch = patches.Circle(xy=(0, 0), radius=5)

add_patch(patch)に入れる

ax.add_patch(patch)

matplotlib のサイトの patches ページ ↓

matplotlib.org

Circle

まずは、Circle です。

Circle を使うことで円が作れます。

matplotlib の patches を使って図形を作る

コードはこちら ↓

from matplotlib import patches
from matplotlib import pyplot as plt

patch = patches.Circle(xy=(0, 0), radius=5)

fig = plt.figure(figsize=(7, 7), facecolor="lightblue")
ax = fig.add_subplot(1, 1, 1, aspect="equal")

ax.add_patch(patch)
ax.autoscale()
ax.grid(color="0.8")

plt.show()

Rectangle

次は、四角です。

Rectangle を使うことで四角が作れます。

matplotlib の patches を使って図形を作る

コードはこちら ↓

from matplotlib import patches
from matplotlib import pyplot as plt

patch = patches.Rectangle(xy=(0, 0), width=2, height=3, angle=20)

fig = plt.figure(figsize=(7, 7), facecolor="lightblue")
ax = fig.add_subplot(1, 1, 1)

ax.add_patch(patch)
ax.autoscale()
ax.grid(color="0.8")

plt.show()

作り方に慣れたら、使いこなせそうです。

※ ちなみに、ax.autoscale()の使い方はよくわかっていません。

yuuuha.hatenablog.com

matplotlib の figure と axes を理解したい

matplotlib は基本中の基本しかわかっていません。

matplotlib を調べていると figure と axes というものが出てきたので調べてみました。

以下のサイトに詳しくわかりやすく説明がありました。

www.yutaka-note.com

figure と axes

figure と axes を調べてみると、figure は「図形」で、axes は「軸」でした。

そのまま翻訳するとよくわからないので、実際に表示してみます。

※axesはまだよくわかってません。

figure

figure は表示範囲のことだと思います。

今まで figure は使っていなかったのですが、plt.plot()を書けば自動的に設定されているようでして、特に設定が必要がなければ書かなくてもよいみたいです。

以下の行を追加すると図のようにサイズと背景(水色部分)が設定できます。

fig = plt.figure(figsize=(5, 5), facecolor="lightblue")

matplotlibのfigureとaxes

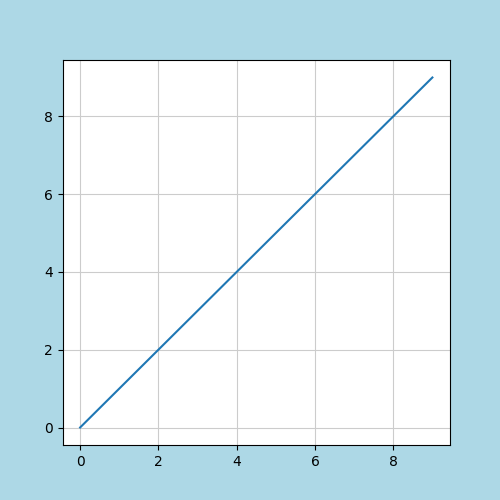
figsize の単位はインチのようです。

import matplotlib.pyplot as plt

x = [i for i in range(10)]
y = [i for i in range(10)]

fig = plt.figure(figsize=(5, 5), facecolor="lightblue")
plt.grid(color="0.8")
plt.plot(x, y)

plt.show()

背景色が設定できるのはテンションが上がって、matplotlib を使うのが楽しくなります。

all_subplot

all_subplotを使うとfigureの中に複数の図を作れます。

以下を1行入れると2つ並べたりできます。

ax1 = fig.add_subplot(1, 2, 1)

(1, 2, 1)で設定します。

最初の(1,2)で行と列を設定してます。

ax1 = fig.add_subplot(1, 2, 1)

3つ目の数字は順番です。「1」が1つ目(左)、「2」が2つ目(右)です。

matplotlibのfigureとaxes

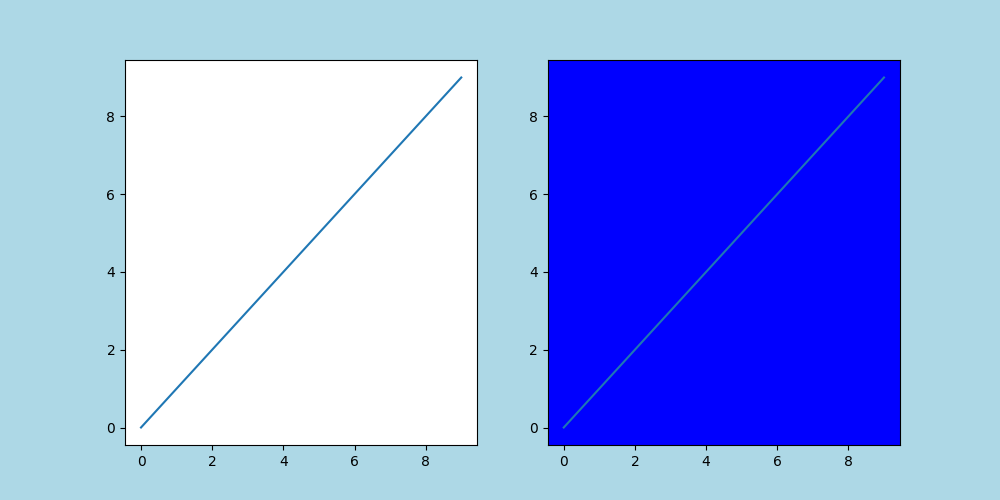
この場合は、右の図に青色をつけています。

import matplotlib.pyplot as plt

x = [i for i in range(10)]
y = [i for i in range(10)]

fig = plt.figure(figsize=(10, 5), facecolor="lightblue")

ax1 = fig.add_subplot(1, 2, 1)
ax1.plot(x, y)

ax2 = fig.add_subplot(1, 2, 2, facecolor="blue")
ax2.plot(x, y)

plt.show()

subplots

all_subplotとは別にsubplotsというのがあります。

使い方は似ていますが、多くのグラフを並べたい場合に良さそうです。

以下の行を追加します。

axes = fig.subplots(2, 3)

(2, 3)の部分で行と列を設定します。この場合は、2行3列です。

matplotlibのfigureとaxes

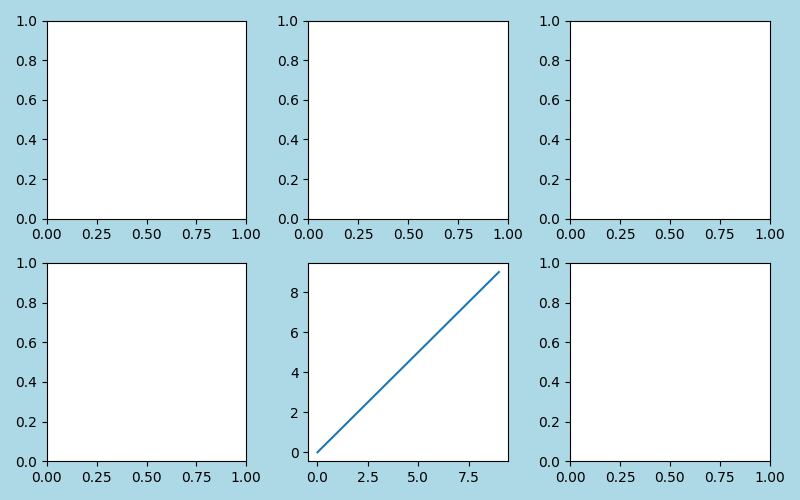
そして、以下の行でどの場所に表を作るのかを決めます。

axes[1, 1].plot(x, y)

左上から右に(0,0)(0,1)(0,2)となり、下の行は(1,0)(1,1)(1,2)となります。

import matplotlib.pyplot as plt

x = [i for i in range(10)]
y = [i for i in range(10)]

fig = plt.figure(tight_layout=True, figsize=(8, 5), facecolor="lightblue")

axes = fig.subplots(2, 3)
axes[1, 1].plot(x, y)

plt.show()

以上です。

figure、axes、subplotについてうまく説明できなかったので、もっと理解できたらリライトします。

Canvasで円を並べる

JavaScriptCanvasで円を並べてみました。

円を並べることは、横幅・縦幅の感覚などいろいろ理解できるので、基本としていいかなと思っています。

今回はforで円をつくり、それを割り算の商と余で縦と横に並べる方法を使っています。

このやり方は書籍「Designing Math. 数学とデザインをむすぶプログラミング入門」で知りました。

並べた画像

まずは円を並べた画像です。

折り返していることがわかるように右端に隙間を開けています。

Canvasで円を並べる

円を並べるコード

円を並べている部分のコードはこちらです。

for文で円を発生させて、x軸は余りをとり、y軸は商をとってます。

商はMath.floor()を使って整数だけにします。

ctx.strokeStyle = 'red' // 円の枠線の色
for (let i = 0; i < n; i++) {
    let x = i % yoko
    let y = Math.floor(i / yoko)
    ctx.beginPath()
    ctx.arc(r + x * r * 2, r + y * r * 2, r, 0, Math.PI * 2, false)
    ctx.stroke()
}

コード全体

右端の余白はなくした版のコードです。

let canvas, ctx
let curYubiX, curYubiY

window.addEventListener('load', () => {
    canvas = document.getElementById('canvas')
    ctx = canvas.getContext('2d')

    ctx.fillStyle = 'antiquewhite'
    ctx.fillRect(0, 0, canvas.width, canvas.height)

    setup()

    function setup() {
        let n = 73 // 円の全個数
        let r = 64 // 半径
        let yoko = 10 // 横に並ぶ円の個数

        ctx.strokeStyle = 'red' // 円の枠線の色
        for (let i = 0; i < n; i++) {
            let x = i % yoko
            let y = Math.floor(i / yoko)
            ctx.beginPath()
            ctx.arc(r + x * r * 2, r + y * r * 2, r, 0, Math.PI * 2, false)
            ctx.stroke()
        }
    }

    // 画像ダウンロード
    let btn = document.getElementById('btn')
    btn.addEventListener('click', () => {
        let a = document.createElement('a')
        a.href = canvas.toDataURL('image/png,1.0')
        a.download = 'canvas-en_narabe'
        a.click()
    })
})

Canvasで円を並べる

yuuuha.hatenablog.com

Canvasで画像をダウンロードしたい

JavaScriptCanvasで画像を制作したあと、もちろん画像をダウンロードしたくなります。
私もダンロードをしようとしました。しかし、情報が少なくてダウンロードができませんでした。
そこで調べてみました。

ダウンロード方法

いろいろ調べてみて、やっとダウンロードできました。
正しいかどうかはわかりませんが、とりあえずダウンロードすることができたコードは以下です。

btn = document.getElementById('btn')
btn.addEventListener('click', () => {
    let a = document.createElement('a')
    a.href = canvas.toDataURL('image/png', 1.0)
    a.download = 'canvas-download'
    a.click()
})

このコードでpngがダウンロードできます。 jpgをダウンロードしたい場合は、4行目をpngからjpegに変更します。

a.href = canvas.toDataURL('image/jpeg', 1.0)

サンプル

サンプルとして、クリックすると円が表示されるものを作りました。 Canvasの画像をダウンロード

▼メインのJavaScript

ダウンロードをする際に背景はcssで作るのではなく、Rectなどで作る必要がありそうです。
cssで作ると背景が真っ黒になってしまいます。

function setup() {
    ctx.fillStyle = 'lightskyblue'
    ctx.fillRect(0, 0, screenWidth, screenHeight)
}

function touchStart() {
    ctx.beginPath()
    ctx.arc(curYubiX, curYubiY, 100, 0, Math.PI * 2)
    ctx.stroke()
}

▼ベースとなるJavaScript

let canvas, ctx
let screenWidth, screenHeight
let curYubiX, curYubiY
let btn

onload = () => {
    canvas = document.getElementById('canvas')
    ctx = canvas.getContext('2d')

    screenWidth = canvas.width
    screenHeight = canvas.height

    setup()

    canvas.addEventListener('mousedown', (e) => {
        let rect = canvas.getBoundingClientRect()
        let bai = screenWidth / rect.width
        curYubiX = (e.clientX - rect.left) * bai
        curYubiY = (e.clientY - rect.top) * bai
        touchStart()
    })

    btn = document.getElementById('btn')
    btn.addEventListener('click', () => {
        let a = document.createElement('a')
        a.href = canvas.toDataURL('image/png', 1.0)
        a.download = 'canvas-download'
        a.click()
    })
}

▼HTML

<canvas id="canvas" width="1280px" height="1280px"></canvas>
<script src="script.js"></script>
<br />
<button id="btn">Download</button>

CSS

html,body{
    text-align: center;
    margin: 0 auto;
}

#canvas{
    background-color: lightskyblue;
    width: 100%;
    height: auto;
    max-width: 640px;
}

Canvasでgenerative artの作品を作りたいなと思ってます。 yuuuha.hatenablog.com